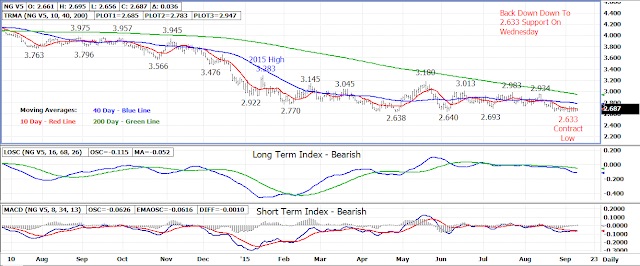
The October 15 natural gas contract turned back lower on
Wednesday from 3-week high resistance reached the previous session at the
lower-2.700 level.
As resistance held again at the 2.725 weekly high, sellers
came back in dropping the October contract back toward the lower end of the
past 3-week range bottoming out at a 2.641 low.
The October contract settled Wednesday’s session at 2.651,
losing .059, but has since moved back higher in today’s early trade toward the
middle of the recent trading range.
The primary trend remains sideways to down with the 2.633
contract low being the first area of support followed by weekly chart support
at 2.550-2.560 and 2.440-2.450. Longer term support is between
2.230-2.250.
2.725-2.735 which has been the top end of the past 3 week
trading range is the first area of resistance followed by the 40 day moving
average currently at 2.780.
Volatility may increase today following release of the EIA
weekly storage report.
Technical Indicators: Moving Average Alignment –
Bearish
Long Term Trend Following Index – Bearish
Short
Term Trend Following Index - Bearish


No comments:
Post a Comment