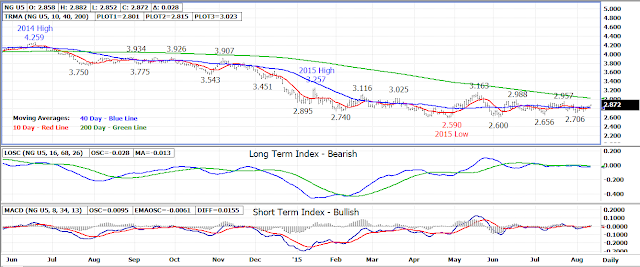
Natural gas prices traded flat on Tuesday as the spot
September 15 contract bounced higher on early weakness off lower-2.800 support
to close the day at 2.844, up 2 ticks.
The market remains in a 14-week sideways trading range with
a triangle forming on the weekly chart. Triangles by definition have a
75% chance of being a continuation pattern rather than a reversal
pattern. In this case, the continuation would be down toward a new price
low for 2015.
Triangle support for the September contract is at the
2.700-2.710 level with resistance at the lower-2.900 level. The September
contract is currently trending back toward upper resistance in today’s early
trade.
A breakout from the triangle will set the trend for the
market with an upside breakout above lower-2.900 resistance being a bullish
indicator which will turn the longer term trend back up.
If the breakout comes to the downside under 2.700-2.710
support as expected, the 2.590-2.600 weekly low will become the next downside
support. Longer term support is between 2.440-2.450 and 2.230-2.240.
Technical Indicators: Moving Average Alignment –
Neutral
Long Term Trend Following Index – Bearish
Short
Term Trend Following Index - Bullish


No comments:
Post a Comment