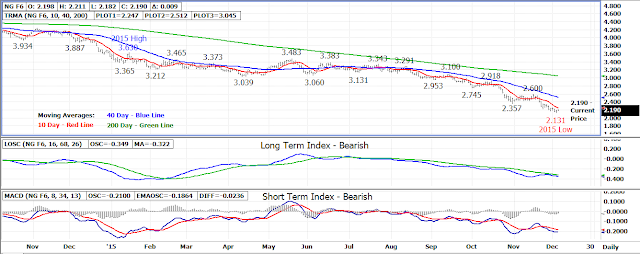
After trading down to yet another new contract low at 2.131
in Thursday’s session, the January 16 natural gas contract moved back higher
into the close settling at 2.185, up .016.
A bullish reversal signal called a doji cross Japanese
candlestick formed on yesterday’s bar but the primary trend at this points
remains down. The 2.131 contract low is the first area of support
followed by 2.051, a low set by the December 15 contract. Longer term and
key support is the 1.948 monthly low set in late-October.
The 10 day moving at 2.245 extending up to the 2.259 weekly
high is the first area of resistance today. Longer term resistance is at
2.350-2.360 followed by the 40 day moving average currently at 2.510.
Technical Indicators: Moving Average Alignment –
Bearish
Long Term Trend Following Index – Bearish
Short Term Trend Following Index - Bearish


No comments:
Post a Comment