The new front month January 16 natural gas contract traded down to a new contract low at 2.175 in today's early trade but was able to rally back higher on the day by the session's close.
The summer 16 natural gas strip (April 16-October 16 contracts) and the winter 16-17 strip (November 16-March 17 contracts) both set new all-time lows last week at 2.417 and 2.750; respectively, but also firmed slightly in today's trade.
There is little supportive news in the market at the present time with near and longer term weather forecasts remaining negative for winter heating demand and storage which has reached a new all-time high of 4,000 Bcf.
There could be the first storage withdrawal of the current winter heating season reported on Thursday which could be a supportive factor for the market. But without sustained winter heating demand to help drawdown record high stocks, rallies should continue to be short-lived.
Dry-gas U.S. production was not released last week by the EIA due to the holiday but was estimated at 70.9 Bcf per day the previous week. Production has fallen from a high of 74.3 Bcf per day reached in December 2014 but is expected to rise next month. The natural gas rig count released on Friday showed the current U.S. rig count at 189, tying an all-time low reached last October.
On the technical front, the 2.000 level remains a strong support level with the 2015 spot contract low of 1.948 being set in late-October. A subsequent sell off last week bottomed out at a 2.051 low before the market reversed back higher.
1.902 was the low price point the last time the natural gas market bottomed in April 2012. This area could again could be a multi-year low during 2015. But the market will need to see a further drop in daily production, an increase in winter heating demand or a combination of the two in order to reverse the current slide in the market price.
Market fundamental remain bearish for natural gas prices. But there are still many months of potential winter heating demand ahead. It might be a bit early to get too bearish the natural gas market at this point.
natural gas

Monday, November 30, 2015
Commitment of Trader's Report - Natural Gas - Fund Long Position Jumps By Over 20% In One Week
The funds were back in the natural gas market last week according to the Commitment of Trader's report released today due to the Thanksgiving Day holiday.
The report showed the current long futures position at 63,414 contracts, up 10,843 contracts or 20.5% from the previous week.
The funds could continue to add to their existing long position if the market begins to stabilize.

The report showed the current long futures position at 63,414 contracts, up 10,843 contracts or 20.5% from the previous week.
The funds could continue to add to their existing long position if the market begins to stabilize.


Dow Jones - Natural Gas Gains On Expectations of Storage Withdrawal
DJ Natural Gas Gains on Expectations of Storage Withdrawal
By Nicole Friedman
NEW YORK--Natural gas prices ticked higher Monday on expectations that record-high stockpiles have peaked.
Natural-gas inventories typically grow between April and October, as producers prepare for the winter-heating season,
then shrink starting in November as demand for the heating fuel increases.
This year, moderate temperatures kept natural-gas consumption subdued in early November, and stockpiles continued to
build through Nov. 20, according to the Energy Information Administration. Inventories are at a record high above 4
trillion cubic feet.
Some analysts expect the EIA will report Thursday that stockpiles shrank for the first time this season in the week
ended Nov. 27, easing concerns that natural-gas storage facilities could run out of room to store the fuel.
"The downside potential for natural gas is becoming limited," said Andy Weissman, chief executive of EBW
AnalyticsGroup, in a note. "Natural gas withdrawals from storage are...likely to be higher than many traders expect,
slowly eroding the huge current storage surplus."
Futures for January delivery recently rose 1.4 cents, or 0.6%, to $2.226 a million British thermal units on the New
York Mercantile Exchange.
However, mild temperatures could keep prices low. Forecasts on Monday showed warmer-than-average weather in the next
two weeks.
"With supply remaining robust and the lack of winter-like weather, nat gas prices are likely to remain weak going
forward," said Dominick Chirichella, analyst at the Energy Management Institute, in a note.
Physical gas for next-day delivery at the Henry Hub in Louisiana last traded at $2.10/mmBtu, compared with last
Wednesday's range of $2.00-$2.10. Cash prices at the Transco Z6 hub in New York last traded at $2.09mmBtu, compared
with Wednesday's range of $1.71-$1.85.
Write to Nicole Friedman at nicole.friedman@wsj.com
Subscribe to WSJ: http://online.wsj.com?mod=djnwireshttp://online.wsj.com?mod=djnwires">http://online.wsj.com?mod=djnwires
>
(END) Dow Jones Newswires
November 30, 2015 10:46 ET (15:46 GMT)
Copyright (c) 2015 Dow Jones & Company, Inc.
113015 15:46 -- GMT
------

Natural Gas Corner - Technical Update - New Contract Low Set Overnight

The January 16 natural gas contract which became the new
front month contract last week has traded down to a new contract low at 2.175
in today’s session but has since traded back toward unchanged.
Today’s early weakness follows selling last week which
dropped the January contact lower by .079 or 3.4% during the holiday-shortened
week settling Friday at 2.212.
The trend at this point remains down with the 2.175
overnight low being the first area of support followed by weekly chart support
at 2.051. Longer term support is the
1.948 monthly low set in late-October.
2.220-2.230 is the first area of resistance today followed
by the 10 day moving average currently
at 2.355.
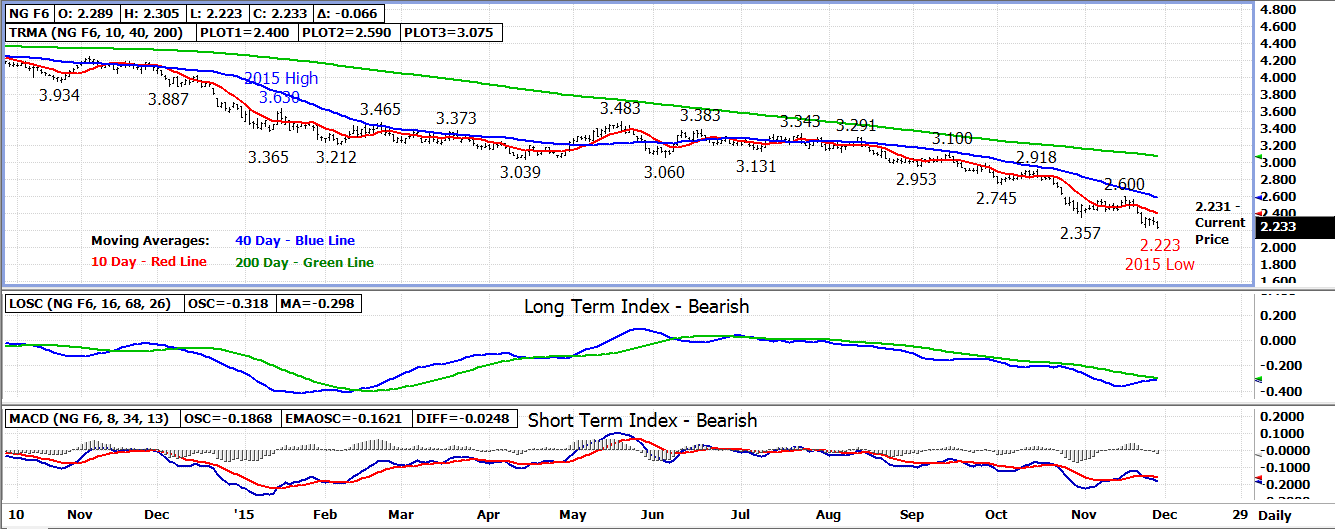
Technical Indicators:
Moving Average Alignment – Bearish
Long
Term Trend Following Index – Bearish
Short Term Trend Following Index - Bearish

Friday, November 27, 2015
Natural Gas Corner - Technical Update - New Contract Low Set Overnight For January 16 Contract
The new front month January 16 natural gas contract has sold
down to a new 2015 and contract low in the overnight session at 2.223 keeping
the bearish technical downtrend intact.
The next downside support beneath the contract low comes
from the weekly chart at 2.051, a low set by the December 15 contract.
Longer term support is at 1.948, a weekly low set in late-October.
Near term, the market could continue lower but the
above-mentioned lows for the market could in fact be multi-year price lows.
The 2.347 weekly high is the first area of resistance
followed by the 10 day moving average currently at 2.400.
Technical Indicators: Moving Average Alignment –
Bearish
Long Term Trend Following Index – Bearish
Short Term Trend Following Index - Bearish
Wednesday, November 25, 2015
EIA Weekly Storage Report - 9 Bcf Injection
For the week ended
Nov 20:
EIA Injection - 9 BCF
Last Year's Draw - 141 BCF
5 Yr Avg Draw - 36 BCF
Range of Estimates - 5 BCF Draw to 10 BCF Injection
Avg Estimate - 4 BCF Injection
Total Gas in Storage - 4.009 TCF
EIA Injection - 9 BCF
Last Year's Draw - 141 BCF
5 Yr Avg Draw - 36 BCF
Range of Estimates - 5 BCF Draw to 10 BCF Injection
Avg Estimate - 4 BCF Injection
Total Gas in Storage - 4.009 TCF


Natural Gas Corner - Technical Update - Another Late Day Rally On Tuesday

A late day rally on Tuesday by today’s expiring December 15
natural gas contract moved it back toward unchanged after trading lower for
most of the session.
The contract finished the session at 2.200 losing .010 on
the day.
The primary trend remains downs although two sell off
attempts over the past 2 sessions have both reversed back higher by the close.
2.130 is the first area of support today followed the 2.051
contract low set earlier this week. Longer term support is the 1.948
weekly low set in late-October.
2.210-2.230 is the first area of resistance today followed
by the 10 day moving average at 2.270.
Technical Indicators: Moving Average Alignment –
Bearish
Long Term Trend Following Index – Bearish
Short Term Trend Following Index - Bearish
Subscribe to:
Posts (Atom)