natural gas

natural gas

Tuesday, May 31, 2016

Latest 6-10 and 8-14 Day National Weather Service Forecasts - Not In Agreement With Private Forecasters


Commitment of Trader's Report - Fund Long Position In Natural Gas Falls

The latest Commitment of Trader's report released on Friday showed a drop in the existing long position held by the hedge funds.

The position as of the 05-24 close was estimated at 108,237 contracts, down 16,733 contracts from the previous week.

The funds are expected to be a strong presence in this market on the long side during 2016 following a new 18-year price low being set in March.


Dow Jones - Natural Gas Shoots Up On Technical Trade

DJ Natural Gas Shoots up on Technical Trade

By Timothy Puko

     Natural-gas prices surged to a new four-month high after futures surpassed an important technical level and
forecasts warmed for one of the country's biggest markets for demand.

     Natural gas for July delivery is up 9 cents, or 4.2%, at $2.259 a million British thermal units on the New York
Mercantile Exchange. That would be one of the biggest percentage gains in the last month. Front-month prices are now up
15% since the June contract expired Thursday at just $1.963/mmBtu.

     July's contract hasn't traded below $2/mmBtu since early March, and summer prices are often higher because of
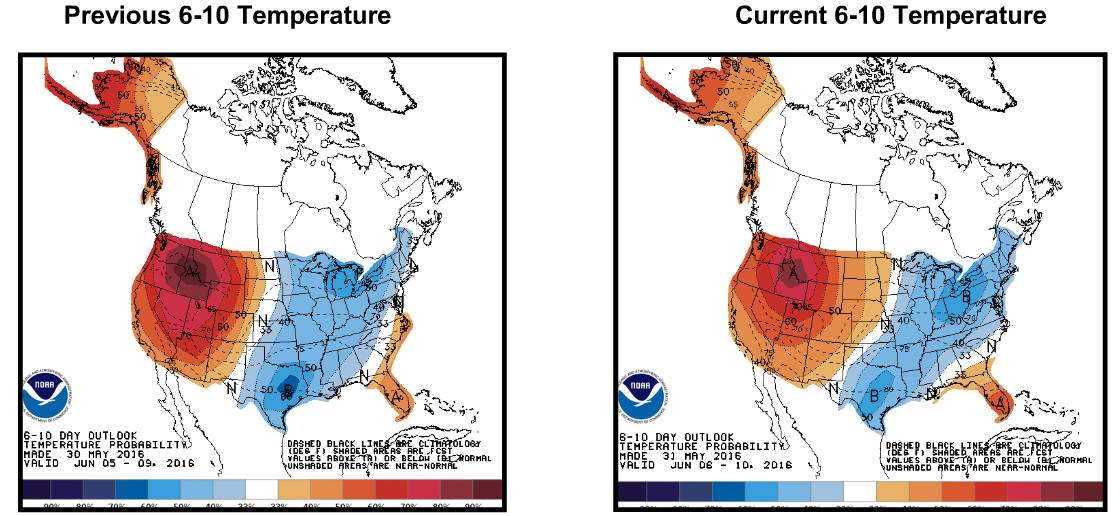
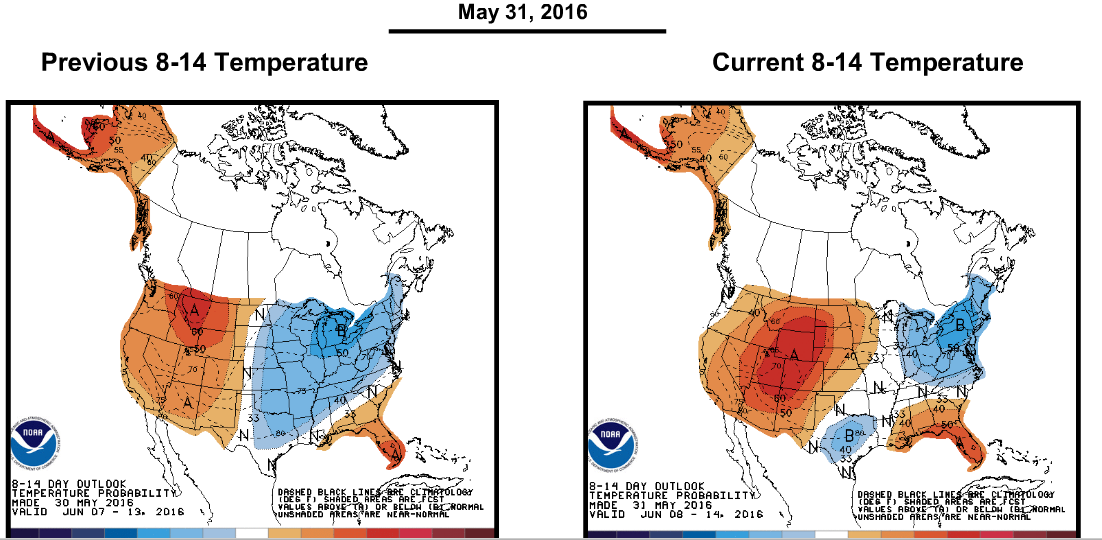
increasing demand for gas-fired power to run air conditioners. Weather updates for mid-June are showing warmer
temperatures in the southeast than Friday's updates before the three-day weekend, and that strengthens demand
expectations in the biggest region for gas-fired power, according to analysts.

     But gas may be getting a bigger boost from technical traders that move on price momentum, a broker and trader
said. Prices moved above their 200-day moving average Tuesday for the first time since November 2014, which appeared to
trigger a lot of buy orders, they said. Nearly half the gains came just at 9 a.m. ET, the traditional start of U.S.
trading hours when volume usually increases dramatically.

     That 200-day moving average is a widely-watched trigger for technical traders to close out bearish positions or
add to bullish positions. It covers a broad period of time, so if prices can stay above it, technical traders see it as
a major indicator the market sentiment has changed.

     "If it stays above there it's significant. Then you can make a case the market is bullish," said Scott Gettleman,
an independent trader in New York.

     Write to Timothy Puko at tim.puko@wsj.com


  (END) Dow Jones Newswires

  May 31, 2016 11:34 ET (15:34 GMT)

  Copyright (c) 2016 Dow Jones & Company, Inc.

053116 15:34 -- GMT
------

Natural Gas Corner - Morning Update

Natural Gas Corner - Technical Update - Short-Squeeze In Progress With Key Support Holding Last Week


A higher open last Monday by the July 16 natural gas contract topped out at a 2.271 high before steadily selling off into Friday’s close.   For the week, the July contract lost .038 or 1.7%settling Friday at 2.169.

The July contract bottomed out at a 2.101 low last Thursday holding above 2.080 weekly low support.  

With support holding  again, buyers have reemerged in this week’s trade rallying the July contract up to 40 day moving average resistance at the 2.220 level. 

A breakout above the 40 day average will  turn the near term trend back up with following resistance at last week’s 2.271 high and the 2.327 early-April high.  Longer term resistance is the 200 day moving average currently at 2.440 which coincides with the 2.427 March high.

This rally could lift the July contract back toward the upper end of the past 3-month trading range.  However, strength should continue to be sold with the expectation for a retest of the 1.939 contract low later this summer. 

Bottom line – Short-squeeze in progress with weekly low support holding again last week.

Friday’s Commitment of Trader’s report showed a decline in the long futures position held by the funds in the natural gas market.  The long position as of the 05-24 close was estimated at 108,237 contracts, down 16,733 from the previous week.

Technical Indicators:  Moving Average Alignment – Bearish
                                         Long Term Trend Following Index – Bearish
                                         Short Term Trend Following Index - Bearish

MDA Earthsat 15 Day Forecast


Friday, May 27, 2016

Have a Safe and Happy Memorial Day Weekend

Natural Gas Corner - Technical Update - Summer Downtrend Progresses


The new front month July 16 natural gas contract begins today’s trade nearly .200 above the price that the June 16 contract expired at in Thursday’s session.

This gap will likely be quickly closed with lower trade ahead by the July contract which settled on Thursday at the 2.151 level.

The first level of support is at 2.080 followed by 2.050-2.060.  Longer term support is the early-March contract low at 1.939 which is expected to be tested and broken as the seasonal downtrend progresses.

The 10, 40 and 200 day moving averages are now in a bearish alignment along with the short and long term RMI indexes.  The 10 day average at 2.170 is the first area of resistance followed by the 40 day average at 2.220.

Bottom line – Bearish momentum increasing.

Technical Indicators:  Moving Average Alignment – Bearish
                                         Long Term Trend Following Index – Bearish
                                         Short Term Trend Following Index - Bearish