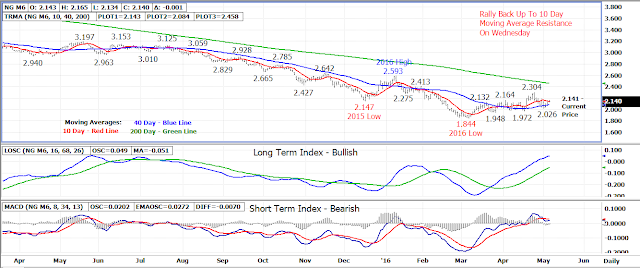
The June 16 natural gas contract temporarily broke out above
10 day moving average resistance as it topped out at a 2.179 morning high on
Thursday.
But early strength began to fade by mid-morning as the June
contract pulled back from the morning highs to turn lower by the close losing
.065 (3%) to settle at 2.076.
Both the 10 and 40 day moving averages were broken as
support on Thursday with the 2.026 weekly low being the next key support
level.
A drop under the 2.026 weekly low will turn the trend back
down with 1.970 and 1.940 being the next support levels followed by the 1.844
contract low.
The 40 day average at 2.090 is the first area of resistance
today followed by the 10 day average at 2.140.
Bottom line – Will lower-2.000 support hold again?
Technical Indicators: Moving Average Alignment –
Neutral-Bearish
Long Term Trend Following Index – Bullish
Short Term Trend Following Index - Bearish


No comments:
Post a Comment