
natural gas

Wednesday, December 23, 2015


Barron's Blog - Natural Gas Will Surpass Oil For Global Energy Use By 2040
DJ Natural Gas Will Surpass Oil For Global Energy Use By 2040, OPEC Says -- Barron's Blog
By Chris Dieterich
The 12-member Organization of the Petroleum Exporting Countries is out with their yearly think piece, " The 2015
World Oil Outlook."
The report recounts the wreckage that has been the collapse in crude prices, though the organization assumes that oil
can average $55 a barrel in 2015 and then rise by about $5 a barrel each year through 2015, reaching about $71 a barrel
by 2020 (in 2014 prices, or $80 a barrel in nominal terms). These aren't OPEC's forecasts, per se, rather they're the
working assumptions that undergird forward-looking models.
Anyhow, the longer-term assumptions for market share of different energy sources anticipate that use of fossil fuels
for energy will continue to dominate by 2040, but also that natural gas will surpass oil by then. There's not a lot of
good news for coal.
"By the 2030s, oil is expected to drop below 28%. A similar trend is expected for coal. By 2040, natural gas is
expected to have the largest share, making up close to 28% of global energy demand with both oil and coal having lower
shares by then."
Other forms of energy will continue to take share:
"Between 2013 and 2040, nuclear energy will increase at 2.2% p.a., on average, making up 5.9% of the world's total
energy consumption by 2040. The share of hydro and biomass, though growing, will remain relatively stable (hydro at
around 2.5% and biomass within a narrow range of 9.5--9.8%). Other renewables, mainly wind and solar, are expected to
grow at the fastest rates, multiplying their contribution to total primary energy supply by more than seven times.
Their overall share will nevertheless remain low, reaching around 4% in 2040."
More at Barron's Focus on Funds blog, http://blogs.barrons.com/focusonfunds/http://blogs.barrons.com/focusonfunds/">http://blogs.barrons.com/focusonfunds/
>
(END) Dow Jones Newswires
December 23, 2015 10:09 ET (15:09 GMT)
Copyright (c) 2015 Dow Jones & Company, Inc.
122315 15:09 -- GMT
------

Natural Gas Corner - Technical Update - Is A Tradable Low In Place?

An 8%+ rally higher on Monday by the January 16 natural gas
contract was followed by a small pull back in yesterday’s session with the
contract losing .023 to settle at 1.888.
The market held up well on Tuesday given the sharp upward
gains made on Monday possibly indicating a near term and possibly long term low
has been set.
Monday’s 1.948 high extending up to 1.959 (top of open gap)
is the first area of resistance followed by 1.990-2.010. A breakout above
lower-2.000 resistance is needed to turn the near term trend back up.
The 10 day moving average at 1.880 is the first area of
support today followed by 1.750-1.760. Longer term support is the 1.684
contract low set on Monday. If contract low support is broken, 1.610 will
become the next downside support.
Technical Indicators: Moving Average Alignment –
Bearish
Long Term Trend Following Index – Bearish
Short Term Trend Following Index - Bullish

Tuesday, December 22, 2015
Dow Jones - Natural Gas Slips As Winter Weather Appears Distant
DJ Natural Gas Slips As Winter Weather Appears Distant
By Timothy Puko
Natural gas prices are retreating as weather forecasts stay too warm to extend gas's biggest rally in nearly a year
to a second day.
Futures for January delivery recently traded down 1 cent, or 0.5%, at $1.901 million British thermal units on the New
York Mercantile Exchange. The retreat comes a day after prices rose 8.1%, their largest one-day percentage gain since
January.
Weather forecasts have chilled a bit, pushing bearish traders to close out to start the week. But they are showing
that cold limited to the Rockies and Texas, with major markets for gas heat still smothered in extremely above-average
temperatures through New Year's Eve.
MDA Weather Services in Maryland is forecasting Christmas Eve highs in the 70s for New York, Philadelphia and
Washington, matching or even hotter than Atlanta. Cash prices at the Transco Z6 hub in New York last traded at
$1.00/mmBtu, compared with Monday's range of $1.45 to $1.60.
Temperatures that warm limit any urgency to buy gas even if forecasts for the country as a whole get slightly
cooler, Dominick Chirichella, analyst at the Energy Management Institute, said in a note.
"Nothing has materially changed from a fundamental perspective to suggest that the ... gas market is ready to enter
into a sustained uptrend," he said.
Physical gas for next-day delivery at the Henry Hub in Louisiana last traded at $1.74/mmBtu, compared with Monday's
range of $1.6625-$1.80.
Write to Timothy Puko at tim.puko@wsj.com
(END) Dow Jones Newswires
December 22, 2015 10:47 ET (15:47 GMT)
Copyright (c) 2015 Dow Jones & Company, Inc.
122215 15:47 -- GMT
------


Natural Gas Corner - Technical Update - Market Gains Over 8% On Monday

A pre-holiday rally on Monday lifted the January 16 natural
gas contract higher by .144 or 8.1% settling the session at 1.911.
Yesterday’s upside strength follows two weeks of heavily
selling which dropped the natural gas market last Friday to a new 14-year spot
contract low at the 1.684 level.
Yesterday’s rally was likely short-covering which should be
followed by a sell off over the next few sessions back toward the 1.684
contract low. If the market does not
quickly sell back off, a near and possibly long term low could be set.
The 10 day moving average broken as resistance on Monday now
becomes the first area of support today at 1.890 followed by 1.780-1.800. Longer term support is the 1.684 contract low
and 1.610, a monthly low from 1998.
Monday’s 1.948 weekly high extending up to the top of the
gap at 1.959 is the first area of resistance today followed by 1.980-2.000. A breakout above 2.000 would turn the 40 day
moving average at 2.250 into the next longer term resistance.
Technical Indicators:
Moving Average Alignment – Bearish
Long
Term Trend Following Index – Bearish
Short
Term Trend Following Index - Bearish
Monday, December 21, 2015
Dow Jones - Natural Gas Gets Boost From Colder Weather Forecasts
DJ Natural Gas Gets Boost From Colder Weather Forecasts
By Timothy Puko
Natural gas prices are posting their largest gains in nearly two months as signs of cold and stronger heating demand
creep into forecasts, chasing many people who had bet against higher gas prices out of their positions.
Futures for January delivery recently traded up 14 cents, or 7.9%, to $1.907 per million British thermal units on the
New York Mercantile Exchange. That would be the second-largest percentage gain for any session since January, trailing
only the 11% gains on Oct. 29 that came primarily from a switch to December as the front-month contract.
Gas had been down 25% to start this month and, since August, money managers have had nearly two bearish positions on
gas for every one bullish position. A market leaning that heavily in any one direction is often vulnerable to snapping
back the other way if traders find a reason to close out positions and lock in profits on successful bets.
Monday-morning weather updates helped do that for gas, several people said. After weeks of unseasonably warm weather
nearly canceling the beginning of heating season, forecasts are starting to show temperatures closer to normal in the
East and below normal in the Rockies to end December.
Power prices are rising in the East and Mid-Atlantic states, and traders are questioning whether January will be as
warm and soft for heating demand as December, said Scott Shelton, broker at ICAP PLC. That is enough to have bearish
traders close out positions to cut their risk of prices surging as winter demand rises, he and others said.
"You don't want to be the guy that's left holding the bag," said John Woods, president of JJ Woods Associates and a
Nymex trader.
Physical gas for next-day delivery at the Henry Hub in Louisiana last traded at $1.77/mmBtu, compared with Friday's
range of $1.685-$1.75. Cash prices at the Transco Z6 hub in New York last traded at $1.60/mmBtu, compared with Friday's
range of $1.68 to $2.00.
Write to Timothy Puko at tim.puko@wsj.com
(END) Dow Jones Newswires
December 21, 2015 12:10 ET (17:10 GMT)
Copyright (c) 2015 Dow Jones & Company, Inc.
122115 17:10 -- GMT
------

Natural Gas Corner - Technical Update - 14-Year Low Set On Friday
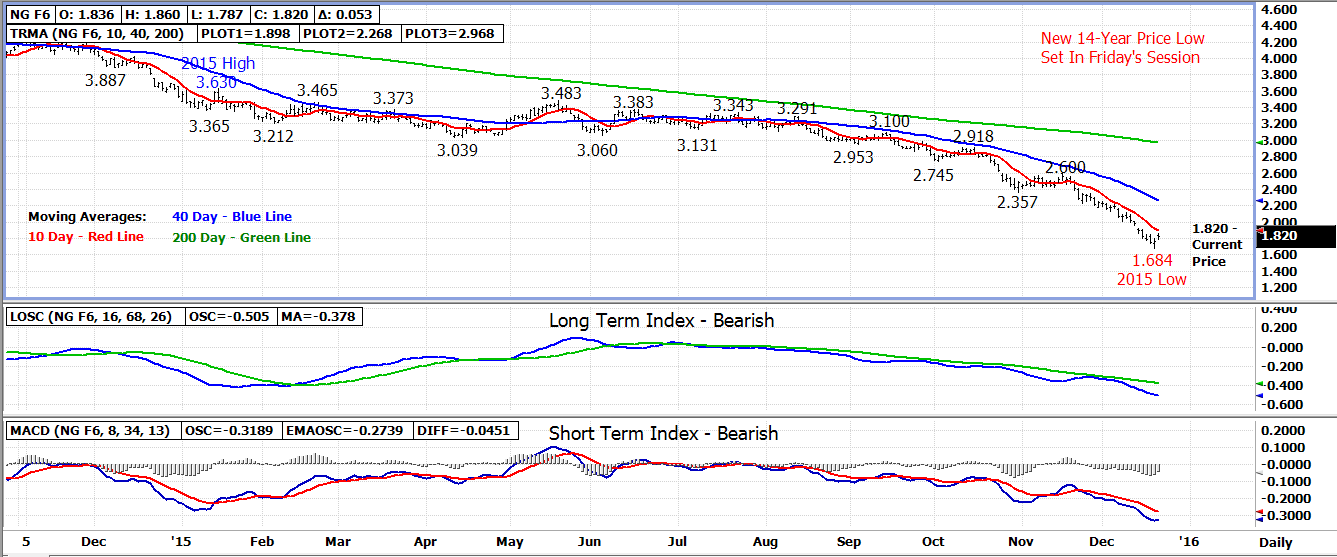
The natural gas has closed down 5 out of the past 6 weeks
trading on Friday down to a new 14-year price low.
The spot January 16 natural gas contract bottomed out at a
1.684 morning low on Friday settling the day at 1.767. For the week, the contract lost .223 or
11.2%.
The market has bounced higher from last week’s low in today’s
early trade but the primary trend remains down.
Last week’s 1.684 low is the first area of support followed by monthly
low support from August 1998 at 1.610.
The 10 day moving average at 1.900 is the first area of
resistance today followed by the open gap created last Monday between
1.923-1.959. A breakout above the top of
open gap area will turn the near term trend back up.
The fund long position in the natural gas market jumped by
over 50% last week according to the Commitment of Trader’s report released on Friday. The fund long futures position rose by 13,268
contracts to 39,479 contracts.
Technical Indicators:
Moving Average Alignment – Bearish
Long
Term Trend Following Index – Bearish
Short Term Trend Following
Index - Bearish
Subscribe to:
Posts (Atom)