
A rally higher on Friday by the September 14 crude oil contract was followed by a sell off back lower in Monday's session as the contract lost .94 to settle the day at 96.41.
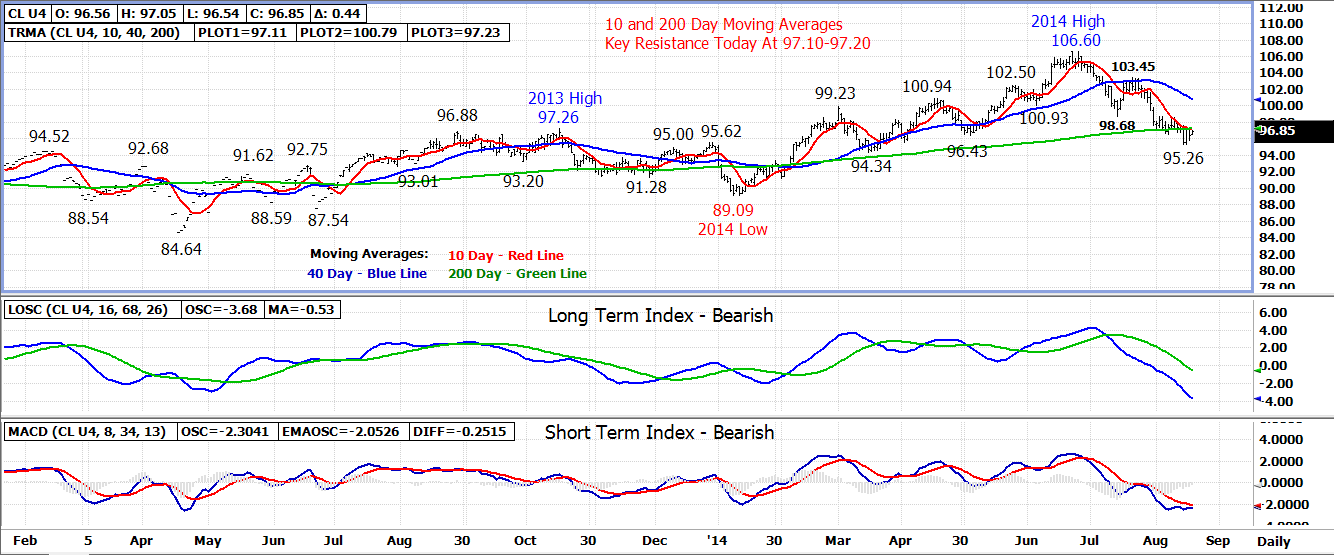
The market trend at this point remains down but could quickly change with a breakout above 10 and 200 day moving average resistance between 97.10-97.20. A close above 97.20 would turn the near term trend back higher with former weekly highs at 98.58-98.67 becoming the next upside resistance.
Longer term resistance is the 40 day moving average currently at 100.80. A close above this average would turn the longer term trend back up.
On the bearish side, a small bear flag pennant may be forming but the market will need to hold below 97.10-97.20 resistance to remain viable. A breakout under last week's 95.26 low would initiate the pennant which would have a downside measuring objective of roughly 2.00 pointing toward the lower-93.00 area.
The eventual breakout, in whichever direction, will likely occur over the next few days of trade.
Technical Indicators: Moving Average Alignment - Neutral-Bearish
Long Term Trend Following Index - Bearish
Short Term Trend Following Index - Bearish
No comments:
Post a Comment