
The August 15 natural gas held in a sideways range for a
third day on Thursday alternating between the lower-2.800 level as support and
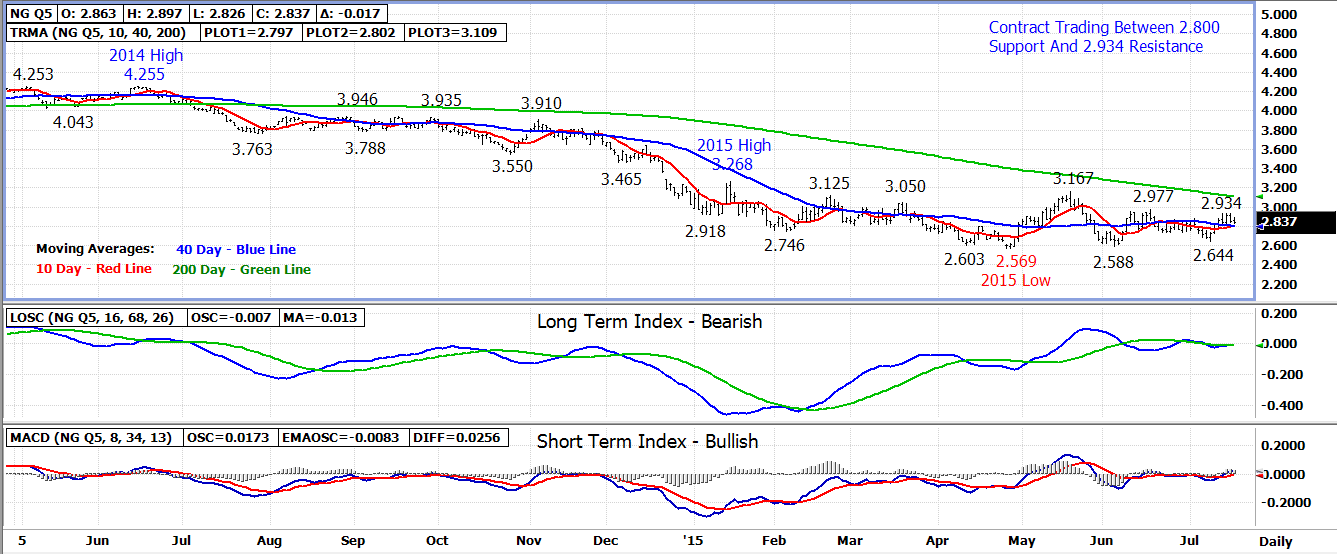
the 2.934 weekly high as resistance.
The August contract did lose .064 (2.2%) in yesterday’s session settling at 2.854.
The primary trend remains sideways to lower although the market could see further near term strength. A breakout above the 2.934 weekly high would turn 2.970-2.980 into the next upside resistance with longer term resistance at the 200 day moving average currently at 3.110.
Once the current rally fades, a drop back under 10 and 40 day moving average support at the 2.800 level is expected which will turn last week’s 2.644 low into the next downside support.
Longer term support levels are the 2.569 and 2.588 weekly lows set during April and June. A drop under weekly low support would keep the longer term market trend bearish with following support at 2.443.
Technical Indicators: Moving Average Alignment – Neutral
Short Term Trend Following Index - Bullish
No comments:
Post a Comment