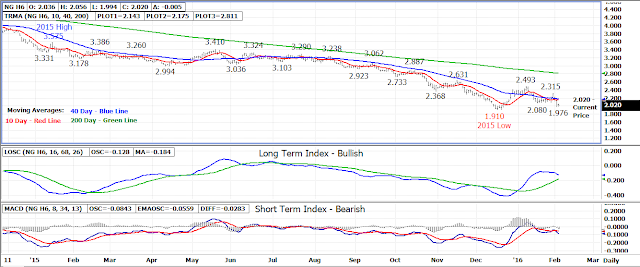
The natural gas market was heavily sold for a second
consecutive day on Tuesday as the spot March 16 contract revisits the
2.000 level for the first time since December 21st.
The March contract bottomed out at a 1.976 low on Tuesday
bouncing back over the 2.000 level by the close to settle at 2.025, down .127
(5.9%).
The trend is now bearish with Tuesday’s 1.976 low being the
first area of support for the March contract followed by the mid-December 1.910
contract low. Longer term support from the weekly chart is at 1.780-1.790
and the 1.684 spot contract low also set in December.
Former support at 2.080 now becomes the first area of
resistance with longer term resistance at the 10 day moving average currently
at 2.140 followed by the 40 day average at 2.175.
Bottom Line – Retest of contract low support expected in
upcoming trade.
Technical Indicators: Moving Average Alignment –
Bearish
Long Term Trend Following Index – Bullish
Short
Term Trend Following Index - Bearish


No comments:
Post a Comment