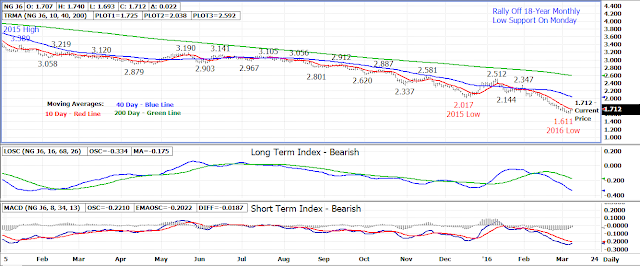
The April 16 natural gas contract rallied higher off 18-year
monthly low support on Monday to begin the new week of trade gaining .024 to
settle at 2.690.
While Monday’s gains may seem small, the daily close came
well above the 1.612 early morning low which for a third time in the past week
held above a key support level.
The key support level is the August 1998 monthly low at 1.610
which by holding could mark a near term turn back higher in the market.
The 10 day moving average 1.725 is the first area of
resistance today. A close above this
average today could bring in further short covering as well as new technical
buying. The next area of resistance
above the 10 day average is between 1.775-1.790 with longer term resistance at
the 40 day moving average currently at 2.050.
1.610 remains key support as a drop under will signal a
resumption of the downtrend with 1.500-1.520 being the next downside support.
Bottom line – A near term low looks like it has been set in
the natural gas market.
Technical Indicators:
Moving Average Alignment – Bearish
Long
Term Trend Following Index – Bearish
Short Term Trend Following Index - Bearish


No comments:
Post a Comment