
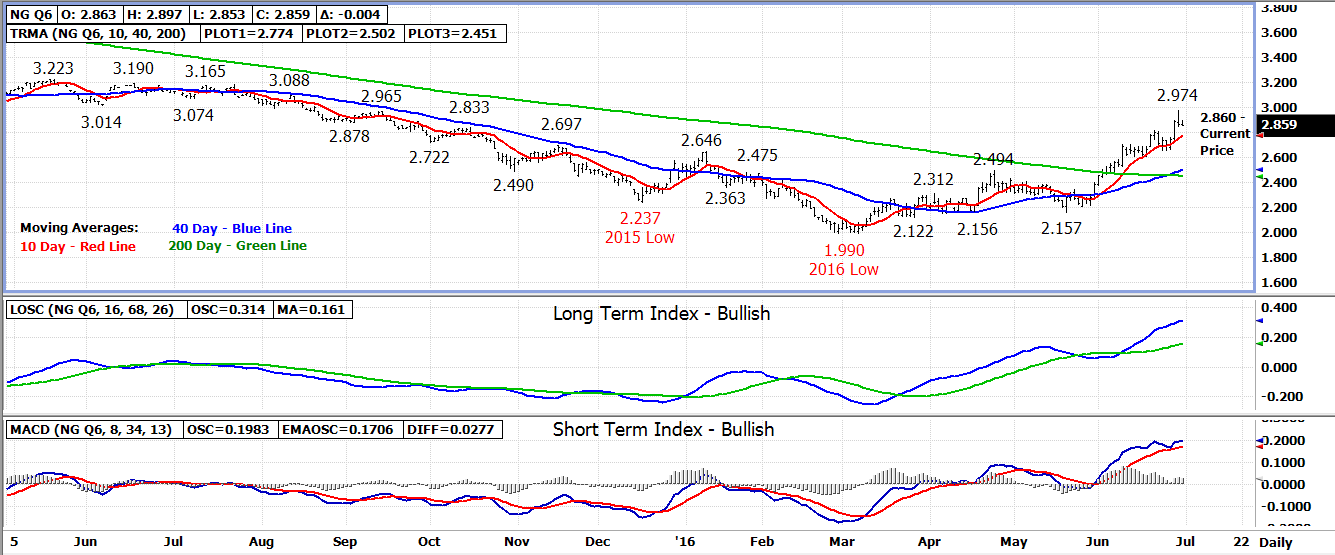
The August 16 natural gas contract started out yesterday’s
session sharply higher rallying up to a price level last reached in August
2015.
The 2.974 daily high came in a resistance area between
2.950-3.050 where the market topped out on a weekly basis last
summer.
Early buying turned into selling by mid-morning dropping the
August contract to a lower close on the day settling at 2.863, down .027.
A bearish shooting star Japanese candlestick formed on yesterday’s bar warning
of a possible near or longer term pull back in the market but the trend at this
point remains up.
Strong selling resistance is expected between 2.950-3.050
which will be interesting to watch as it gets tested in upcoming trade.
Former daily high resistance at 2.812 is the first area of
support under yesterday’s 2.844 low followed closely behind by the 10 day
moving average at 2.775. It was from 10 day moving average support
reached earlier this week from which the latest rally higher began. A
close under the 10 day average could signal a reversal is in progress.
Bottom line – Bearish technical signals forming but no
change in upward trend yet evident.
Technical Indicators: Moving Average Alignment –
Bullish
Long Term Trend Following Index – Bullish
Short Term Trend Following Index - Bullish
No comments:
Post a Comment