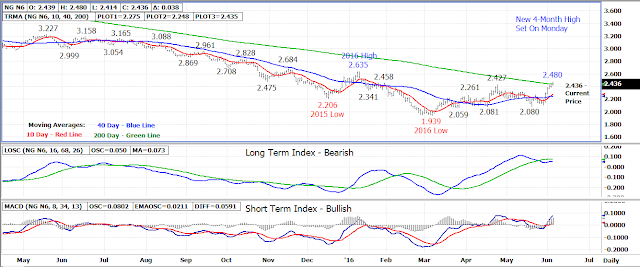
Natural gas prices rocketed higher in last week’s trade
staging one of the biggest weekly gains of 2016. The spot July 16
contract gained .229 or 10.5% during last week’s holiday-shortened session
closing Friday at 2.398.
A new 4-month high of 2.480 was posted in today’s early
session as the July contract attempts an upside breakout above 200 day moving
average resistance at the 2.440 level today.
If 200 day moving average resistance is broken, the trend
will remain up with the 2.635 high from early-January becoming the next
longer term resistance.
Former resistance between 2.320-2.340 now becomes the first
area of support followed by the 10 and 40 day moving averages which are now in
a bullish alignment. The 10 day average at 2.275 is the next area of
support under 2.320 followed by the 40 day average at 2.250.
Bottom line – A breakout or failure at 2.400-2.450
resistance?
Friday’s Commitment of Trader’s report showed a sharp drop
in the speculative long position held by the funds in natural gas. The
long futures position as of the 05/31 close was estimated at 84,329
contracts, down 23,908 contracts (22%) from the previous week.
Technical Indicators: Moving Average Alignment –
Neutral-Bullish
Long Term Trend Following Index – Bearish
Short Term Trend Following Index - Bullish


No comments:
Post a Comment