
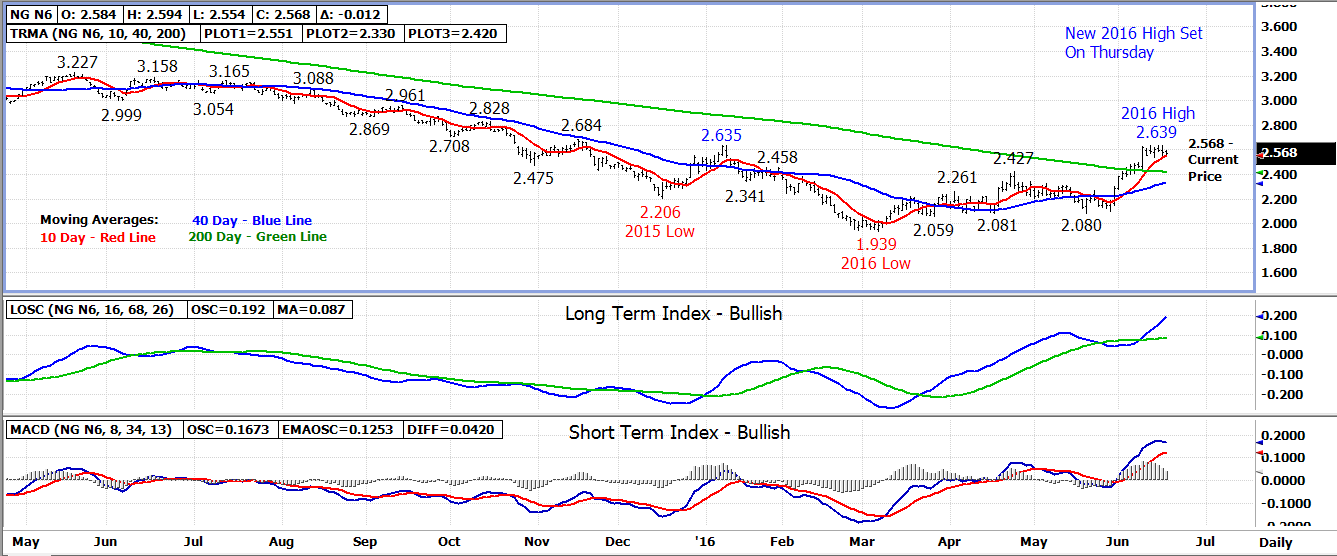
The July 16 natural gas contract pushed up to a new 2016
contract high on Thursday at the 2.639 level exceeding the previous high set
last week by 4 ticks.
However, no follow through buying materialized on the
breakout attempt as the contract instead slumped lower into the close settling
the day at 2.580, down .015.
The 10 day moving average at 2.550 today held as support in
yesterday’s session as well as in today’s early trade. A close under this
average could indicate a near term top has been set in the market with
following support at 2.490-2.500. A drop under 2.490-2.500 could initiate
further liquidation selling as this was a previous “breakout” resistance area.
Longer term support levels are the 200 day moving average at
2.420 and the 40 day average at 2.330.
A breakout above Thursday’ 2.639 high is needed to keep the
primary trend bullish. If this occurs, 2.680-2.690 will become the next
upside resistance.
Bottom line – Key test of 10 day moving average support
today.
Technical Indicators: Moving Average Alignment –
Neutral-Bullish
Long
Term Trend Following Index – Bullish
Short Term Trend Following Index - Bullish
No comments:
Post a Comment