
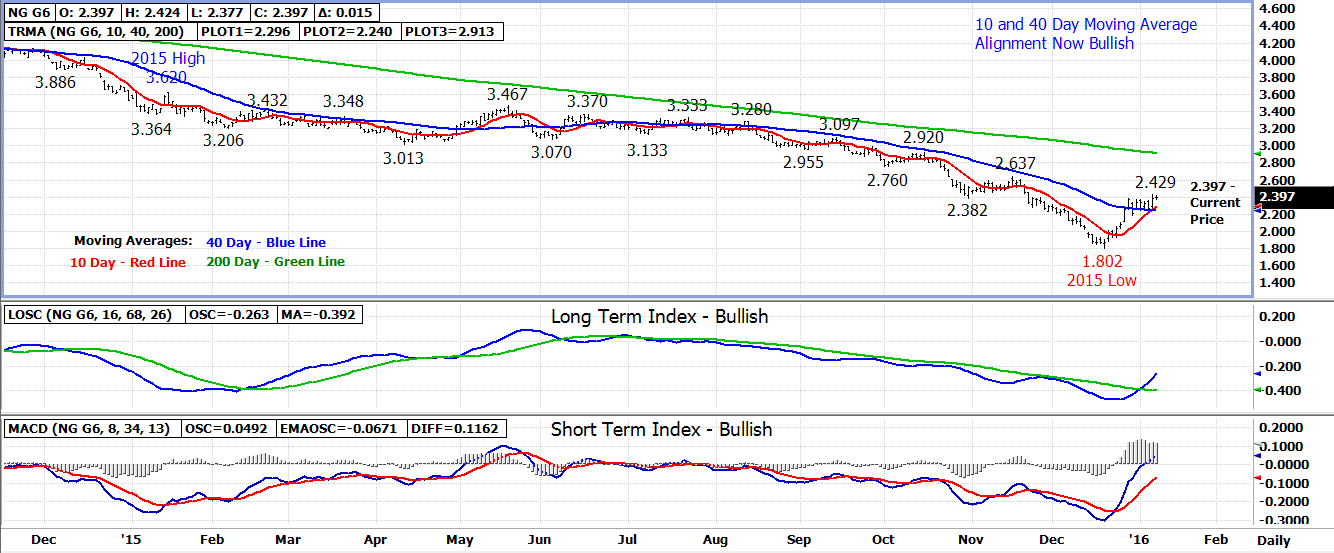
The February 16 natural gas contract rallied sharply higher
in Thursday’s session bouncing off 10 and 40 day moving average support on
early weakness to close the day at 2.382, up .115 or 5%.
The 10 and 40 day moving averages are now in a bullish
alignment for the first time since last July keeping the near term trend
bullish.
Thursday’s 2.429 high is the first area of resistance
followed by 2.500-2.520. Longer term resistance is between 2.570-2.630.
Former daily high resistance at 2.380-2.390 is now the first
area of support with longer term supports at the 10 day moving average at 2.300
followed by the 40 day average at 2.250. A close under both averages is
needed to turn the near term trend back down.
Bottom Line – Bulls remain in control.
Technical Indicators: Moving Average Alignment –
Neutral-Bullish
Long
Term Trend Following Index – Bullish
Short Term Trend Following Index - Bullish
No comments:
Post a Comment