
An failed early rally attempt on Monday was followed by a
steep selloff into the session’s close by the August 16 natural gas contract
which lost .099 (3.5%) to settle the session at 2.702.
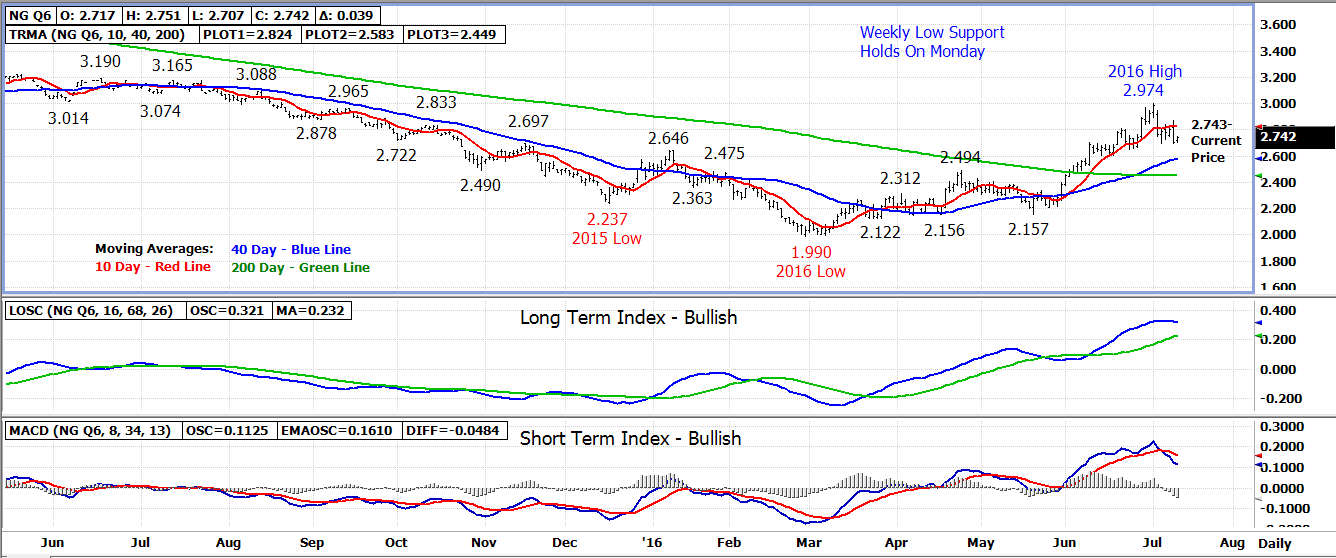
The one positive note for the bulls on Monday was that the
August contract bottomed out at a 2.696 low, one tick under the level the
market bottomed out at last week.
With weekly low support holding, buyers have come back in
during Tuesday’s early trade.
The August contract has now closed under the 10 day
moving average for four consecutive days which is a bearish indicator. A
drop under 2.696 weekly low support is now needed to extend the downtrend with
following support at 2.650 and the 40 day moving average currently at 2.580.
Former daily lows between 2.725-2.750 are now the first
areas of resistance followed by the 10 day moving average currently at
2.825. A close back above the 10 day average will turn the near term
trend back up likely leading to a retest of the early-July 2.974 high.
Bottom line – Bulls down but not yet out.
Technical Indicators: Moving Average Alignment –
Neutral-Bullish
Long
Term Trend Following Index – Bullish
Short Term Trend Following Index - Bearish
ENERGY :
ReplyDeleteNatural Gas April expiry has tumbled 3.3 percent to $ 2.705.
Crude Oil March and Brent Oil April series have advanced 0.4 percent each at $ 54 and $ 56.57 per barrel, respectively.capitalstars