
The natural gas market remains locked in a sideways trading
range with a triangle consolidation pattern forming on the weekly chart.
In last week’s trade, the September 15 contract rallied up
to a 2.943 high early in the week but lost nearly 5% in Thursday’s
session. By Friday’s close, the contract was trading back nearly where it
began settling at 2.801, up 3 ticks for the 5 days of trade.
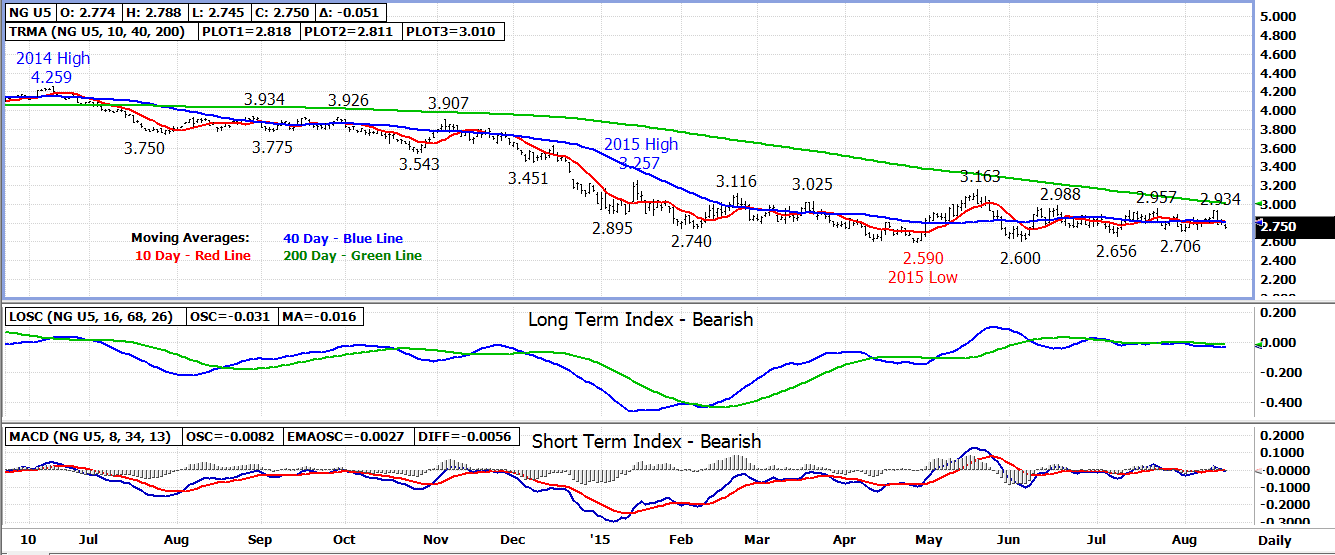
Last week’s 2.934 high held below upper triangle trend line
resistance which keeps the triangle pattern on the weekly chart intact.
Lower triangle trend line support is at the 2.720-2.740 level with a breakout
under this level needed to trigger the triangle.
If the bearish triangle is initiated, it should be the final
price break in the market before a post-summer seasonal low is set.
Friday’s Commitment of Trader’s report showed the
funds long 137,339 natural gas futures contracts, up 446 for the
week. The funds have been largely absent from the market this summer as
prices have remained in a sideways trading range.
Technical Indicators: Moving Average Alignment –
Bearish
Long Term Trend Following Index – Bearish
Short Term Trend Following Index - Bearish
No comments:
Post a Comment